Cheerp Memory Profiler
Starting from Cheerp 2.0, commercial users have access to the Cheerp Memory Profiler. This tool allows one to monitor memory use in real-time, and profile memory to identify leaks or inefficiencies.
The Cheerp memory profiler can be used from within the source code (e.g: to assert that there are no leaks inside a certain block) or from the browser console. We provide a visualisation tool that can be simply included in the HTML page hosting compiled code to get an overview of real-time memory consumption during the application lifetime. [Commercial Licence].
Requirements
The Cheerp memory profiler is built specifically for tracking allocations on WebAssembly memory (i.e. the linear memory heap). JavaScript memory can be profiled using the existing, browser-integrated developer tools.
To use the tool, you need to link the memprof library to your C/C++ project compiled with Cheerp, for example:
/opt/cheerp/bin/clang++ -target cheerp-wasm -cheerp-linear-output=asmjs -cheerp-pretty-code *.cpp -o target.js -lmemprofWe recommend using the -cheerp-pretty-code command line options to get readable stack trace.
Memory usage graph
You can use the memprofui.js visualiser to get a real-time view of memory usage. Once you have a file compiled with the memprof library, you only need to add a script tag and initialise the visualiser. The visualiser component needs to access the DOM, so it can only be used for code running in the main thread (i.e. not a WebWorker).
<!doctype html><html lang="en"> <head> <meta charset="utf-8" /> <title>Cheerp test</title> </head> <body> <script src="target.js"></script> <!-- Add this line, telling the page to load the UI --> <script src="https://cheerp.leaningtech.com/memprofui.js"></script> <!-- There are two parameters, the length in seconds of the profiling window and how often the samples should be registered in milliseconds. Here 60 seconds and sampling every 100ms--> <script> var cheerpMemUI = new CheerpMemUI(60, 100); </script> </body></html>You should see at the bottom of the browser window a graph similar to this one:

On the horizontal axis you can see the time from the start of the program, and on the vertical the memory consumption at any given moment.
The chart has 2 parameters that have to be provided via the constructor: the length of the window you would like to track (in seconds) and the sampling period (in milliseconds). Providing a non-positive number as window length gives an overview over all the lifetime of the page.
Console-based API
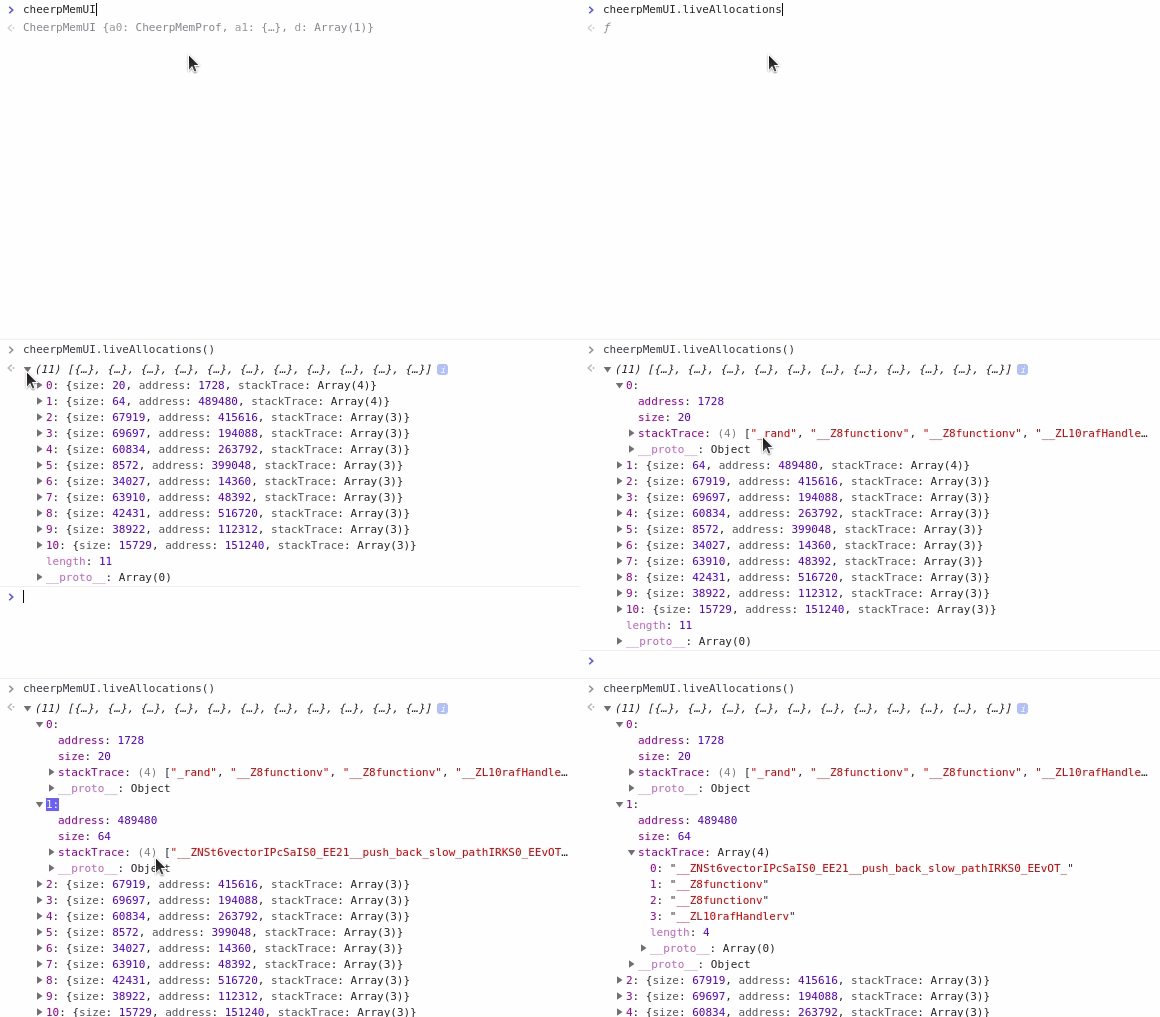
On the line ”var cheerpMemUI = new CheerpMemUI(60, 100)” we created an object cheerpMemUI. This can be leveraged from the developer console in three ways:
cheerpMemUI.totalLiveMemory()
Returns the current total amount of allocated memory.
cheerpMemUI.lastSamples()
Returns an array with the amount of used memory at every step in the profiling window, so that you can examine the total amount at each sample.
cheerpMemUI.liveAllocations()
Returns information for all the live allocations:
- starting address of the memory block
- size of the memory block
- stack trace that led to the creation of that block of memory, parsed and formatted

Introspection API
If you need control on what memory allocations you want to profile, we provide also an introspection API which can be used directly from your code. In this case you need to #include <cheerp/memprof.h> in addition to compile with -lmemprof.
You will then be able to call these functions:
CHEERP_MEMPROF_TAG cheerpMemProfAnnotate(const char *tag_name);
Create a named tag that will records the allocations/free that follows. It returns a handle that have to be saved to be able to ask information about this particular tag. Multiple tag can be open at the same time.
void cheerpMemProfLive(CHEERP_MEMPROF_TAG tag);
Report (on the browser console) the memory allocated after the tag creation and not yet freed. This function have to be called with the handle returned by a call to cheerpMemProfAnnotate().
void cheerpMemProfClose(CHEERP_MEMPROF_TAG tag);
Report the memory allocated after the tag creation and yet to be freed, and close the tag. Any following use of the tag is undefined.
size_t cheerpMemProfUsed(CHEERP_MEMPROF_TAG tag);
Return the amount of memory allocated after the tag creation but not yet freed. Useful to assert that there have been no leaks in a certain portion of a function/program.
size_t cheerpMemProfTotalUsed();
Return the total amount of memory currently allocated by the program.
Example
auto tag = cheerpMemProfAnnotate("functionX wrapper");functionX();   //function that should ideally not generate permanent allocationsif (cheerpMemProfUsed(tag) > 0){     // Unexpected leak from functionX()
     // Print on the console all the memory allocations created inside functionX and not freed     cheerpMemProfLive(tag);
     assert(false);}//close the tagcheerpMemProfClose(tag);
Performance
We designed the Cheerp Memory Profiler to be less intrusive as possible, both regarding the performance and modification required on your code.
cheerpMemProfTotalUsed() executes in constant time. The other functions in time linear on the number of memory blocks currently alive. Every malloc/free in the code also have to incur an execution cost that’s logarithmic on the number of memory blocks currently alive.