
How to debug the extension
How to enable debug mode and collect logs for troubleshooting
If you encounter issues while running a Java Web Start application with CheerpJ JNLP Runner, enabling Debug Mode can provide detailed logs that help our support team identify the problem.
Verifying the Extension is Working

Before enabling debug mode, let’s verify if the extension is active and properly handling JNLP files:
- Is the extension pinned? Ensure the CheerpJ JNLP Runner is pinned to your browser’s toolbar so you can easily access it.
- Is the extension enabled? Check your browser’s extensions page (
chrome://extensionsoredge://extensions) to confirm it is toggled on. - Are you using the correct extension? Make sure you have the CheerpJ JNLP Runner installed (not the Applet Runner).
- Does the application launch? When you click a
.jnlplink, the application should start automatically, with the extension side panel on the left side of the screen. - Did the JNLP file download instead? If your browser downloads the
.jnlpfile instead of launching the application, you can use drag and drop to test it—simply drag the downloaded file into the extension popup. - Are there any Network errors? Open the browser’s developer tools and check the Network tab for failing requests.
- Are you seeing startup or socket errors? If the application fails during startup, or reports errors when opening network (socket) connections, please reach out to us on our Discord server
 for further assistance.
If everything above is functioning correctly but you are still experiencing issues, please reach out to us on our Discord server or by opening an issue on our GitHub repository so we can assist you. To help us troubleshoot, please enable debug mode as described below and provide the resulting logs.
Enabling Debug Mode
To enable the debug build of CheerpJ:
-
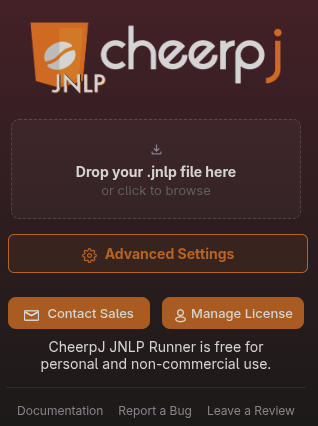
Click the CheerpJ JNLP Runner icon in your browser’s toolbar, then click Advanced Settings in the popup.
-
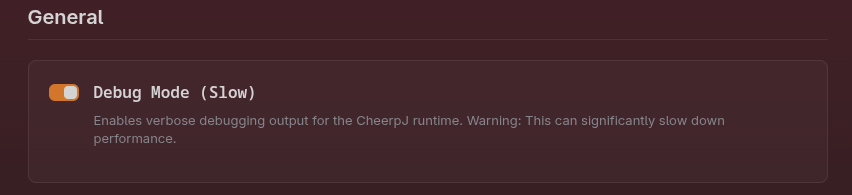
Under General, toggle Debug Mode (Slow) to On.
-
The extension will now use the debug version of the runtime, which includes extensive logging but runs more slowly.
Reload RequiredYou must enable the debugging mode before loading your application, or reload the page after enabling it. Otherwise, the setting will not take effect.
Collecting Debug Information
To help us troubleshoot, we typically need two files: the Console log and a Network HAR file.
Step 1: Open Browser DevTools
To ensure we receive complete logs, you must reload the page after opening the developer tools.
- Press
F12(Windows/Linux) orCmd + Opt + I(Mac) to open the DevTools. - Alternatively, right-click anywhere on the page and select Inspect.
Step 2: Save the Browser Console Output
- With the developer tools open, navigate to the Console tab. (If you don’t see it, click the
+symbol in Edge or>>in Chrome, then select Console). - If needed, trigger the error in your application.
- Right-click on any message in the console tab and select Save as…
- Save the console log to a file.
Step 3: Extract a HAR File
A HAR (HTTP Archive) file logs your browser’s network interactions and helps us diagnose loading or server responses.
- In the developer tools, navigate to the Network tab.
- Reload your page to ensure the network log captures requests from the very beginning.
- Trigger the error in your application if needed.
- Click the download icon (
↓) at the top right of the Network tab to export and save the HAR file.
Once you have collected these files, please attach them to your support request or bug report on our Discord server or GitHub repository.